Archiv für den Monat Oktober 2014

Offenheit, Rückhalt, Freiräume: Was die Generation Y von ihrem Chef erwartet

GenerationY2014Boss

Ein gutes Gehalt ist verlockend, aber für die Generation Y nicht das Wichtigste. Wenn junge Erwachsene ihren Arbeitsplatz wählen, sind für sie andere Qualitäten von Bedeutung: Sinn, Weiterbildungsmöglichkeiten oder die Vereinbarkeit von Familie und Beruf. Dazu gehört selbstredend eine Führungskraft, die dies auch ermöglicht – doch welche Eigenschaften muss diese mitbringen? Welche Führungsqualitäten wünscht sich die Generation Y konkret von ihrem Chef oder ihrer Chefin? Der ideale Vorgesetzte muss vor allem offen und ein guter Kommunikator sein, so das jüngste Ergebnis des Forschungsprojekts „Was wird aus den ‚Digital Natives‘?“ der Hamburg Media School in Zusammenarbeit mit XING.

Im Umkehrschluss: Wer hoch qualifizierte junge Leute sucht, der sollte seine starren Hierarchien aufweichen, aufs übliche Chefgetue verzichten und Frontalanweisungen nach dem Top-Down-Prinzip vermeiden – für viele Unternehmen der „Old Economy“ eine Herausforderung. Mehr als tausend berufstätige Erwachsene zwischen 23 und 35 Jahren wurden unter anderem gefragt: Wie wichtig ist Ihnen Loyalität? Hätten Sie lieber klare Handlungsanweisungen? Mögen Sie direktes und häufiges Feedback? Ist Ihnen berufliche Weiterbildung wichtig? Brauchen Sie offene Kommunikation mit Ihrem Chef?

GenerationY2014

Die Ergebnisse zeigen deutlich, was die „Generation Y“ erwartet. Vor allem für die jüngeren Frauen ist besonders wichtig, dass der Vorgesetzte sich offen und kommunikativ verhält. Zudem ist der ideale Chef ein loyaler, authentischer und glaubwürdiger Typ, der auch Rückhalt bietet. Bemerkenswert: Flexibilität beim Arbeiten ist den Digital Natives sehr viel wichtiger als etwa Weiterbildungsmöglichkeiten. Überraschend auch, dass eine gute Feedback-Kultur und gegenseitige konstruktive Kritik für die junge Generation eine eher untergeordnete Rolle spielt.

Und wie sieht die Realität aus? Wie erleben die Digital Natives ihre Vorgesetzten am Arbeitsplatz, wie groß also ist die Kluft zwischen Führungsanforderung und Führungspraxis?

Das wichtigste Ergebnis: Die Mehrheit der jungen Erwachsenen ist mit dem Führungsstil im eigenen Unternehmen zufrieden. Vor allem die ganz Jungen finden, dass die Vorgesetzten ihnen zur Seite stehen und sie gut anleiten. Allerdings sagt jeder Vierte, bei ihm würden die Führungskräfte die Mitarbeiter nicht genügend wertschätzen. Und insbesondere viele ältere Digital Natives fühlen sich von ihren Vorgesetzten verunsichert, kontrolliert und unter Druck gesetzt.


Eckdaten der Erhebung:
Seit Frühjahr 2014 führt das Team des „HMS Think Tank Journalismusforschung“ (Leitung: Prof. Dr. Michael Haller) in Kooperation mit dem Business-Netzwerk XING und TrendResearch Hamburg jeden Monat eine Befragung der „Generation Y“ durch. Im Zentrum der Studie „Was wird aus den Digital Natives?“ stehen Fragen zum Informations- und Mediennutzungsverhalten sowie zur neuen Arbeitswelt. Sie ist Teil des Forschungsprojekts „Die Zukunft der Medien“. Diese Erhebungswelle fand im September / Oktober 2014 statt. Es wurde eine Stichprobe von 1.037 jungen Berufstätigen zwischen 23 und 35 Jahren (mindestens mittlere Reife als formaler Bildung) mit einem standardisierten Fragebogen online be-fragt; die Befragten gehören zur ersten Generation, die mit den digitalen Medien (Computer, Computerspiele, Handy, Smartphone) aufgewachsen ist („Digital Natives“). Weitere Informationen: http://www.hamburgmediaschool.com/forschung/think-tank-journalismus/aktuelle-studie/

Quelle: https://spielraum.xing.com/2014/10/offenheit-rueckhalt-freiraeume-was-die-generation-y-von-ihrem-chef-erwartet/?pid=b7237_cnwsl

Werbung

Why Amazon has no profit—and why it works

Amazon has a tendency to polarize people. On one hand, there is the ruthless, relentless, ferociously efficient company that’s building the Sears Roebuck of the 21st century. But on the other, there is the fact that almost 20 years after it was launched, it has yet to report a meaningful profit. This chart captures the contradiction pretty well—massive revenue growth, no profits, or so it would seem. But actually, neither of these lines gives you a good sense of what’s really going on.

Amazon discloses revenue in three segments—Media, Electronics & General Merchandise (‘EGM’) and ‘Other’, which is mostly AWS. As this chart shows, these look very different (this and most of the following ones use ’TTM’—trailing 12 months, which smooths out the seasonal fluctuations and makes it easier to see the underlying trends). The media business is still growing, but it’s the general merchandise that has powered the explosion in revenue in the past few years. Meanwhile, the ‘Other’ line is growing but is still much smaller.

Splitting out the detail, we can see this trend both in North America (NA) and internationally…

Though the takeoff is particularly strong in the USA.

Media overall was only 25% of Amazon’s revenue last quarter, and 20% of North America.

And if we go back to ‘Other’ and zoom in, the growth is pretty dramatic there too.

It seems pretty likely that these businesses, selling very different products bought with different bargaining positions to different people with different shipping costs, have different margin potential.

This still doesn’t really give an accurate picture, though. Amazon is in fact organized not just in these segments, but in dozens and dozens of separate teams, each with their own internal P&L and a high degree of autonomy. So, say, shoes in Germany, electronics in France or makeup in the USA are all different teams. Each of these businesses, incidentally, sets its own prices. Meanwhile, all of these businesses are at different stages of maturity. Some are relatively old, and well established, and growing slower, and are profitable. Others are new startups building their business and losing money as they do so, like any other new business. Some are very profitable, and some sell at cost or at as loss-leaders to drive traffic and loyalty to the site. Books are a good example. There’s a widespread perception that Amazon sells books at a loss, but the average sales price actually seems to be very close to physical retailers—it discounts some books, but not all, and despite all the argument in the Agency lawsuits, quite how many and how much is (deliberately) as clear as mud.

Amazon is a bundle.

The clearest  expression of this is Prime, in which (amongst other things) entertainment content is included at a high fixed cost to Amazon (buying the rights) but no marginal cost beyond bandwidth, as a way to enhance the appeal of being a Prime ‘member’. Prime membership in turn draws people to switch more and more of their online and offline spending to Amazon. Trying to look at the profitability of the video alone misses the point.

And then there are the third party sales. Just as AWS is a platform both for Amazon’s own internal technologies and for thousands of startups, so too the logistics and commerce infrastructure themselves are a platform for lots and lots of different Amazon businesses, and also for lots of other companies selling physical products through Amazon’s site. Third party sales of products through Amazon’s own platform are now 40% of unit sales, and the fees charged to these vendors are now 20% of Amazon’s revenue.

This means, in passing, that for close to half of the units sold on Amazon.com, Amazon does not set the price, it just takes a margin. This alone should point to the weakness of the idea that Amazon’s growth is based on selling at cost or at a loss.

The tricky thing about these third party (‘3P’) sales is that Amazon only recognizes revenue from the services it provides to those companies, not the value of the goods sold. So if you buy a pair of shoes on Amazon from a third party, Amazon might collect payment through your Amazon account and ship them from its warehouse using its shipping partners—but only show the shipping and payment fees it charged to the shoe vendor as revenue. It does not disclose the gross revenue (‘GMV’). Given that (as it does disclose) third party sales tend to have a higher unit value, this means that the total value of goods that pass though Amazon with Amazon taking a percentage is perhaps double the revenue that Amazon actually reports. So, the revenue line is not really telling you what’s going on, and this is also one reason why gross margin is pretty misleading too. Gross profit has risen from 22.4% in 2011 to 27.2% in 2013, but this does not really reflect a change in consumer pricing and margins thereof, but rather this change in mix.

So, we have dozens of separate businesses within Amazon, and over two million third party seller accounts, all sitting on top of the Amazon fulfillment and commerce platform. Some of them are mature and profitable, and some are not. And someone at Amazon has the job of making sure that each quarter, this nets out to as close to zero as possible, at least as far as net income goes. That is, the problem with net income is that all it tells us is that every quarter, Amazon spends whatever’s left over to get the number to zero or thereabouts. There’s really no other way to achieve that sort of consistency.

If you listen closely, Amazon itself tells us this. The image below comes straight from Amazon—originally it was a napkin sketch by Jeff Bezos. Note that there’s no arrow pointing outwards labeled  ‘take profits.’ This is a closed loop.

(Source: Amazon)

(Source: Amazon)

In any case, profits as reported in the net income line are a pretty bad way to try to understand a business like this—actual cash flow is better. As the saying goes, profit is opinion but cash is a fact, and Amazon itself talks about cash flow, not net income (Enron, for obvious and nefarious reasons, was the other way around). Amazon focuses very much on free cash flow (FCF), but it’s very useful to look also at operating cash flow (OCF), which is simply what you get adding back capital expenditure (‘capex’). In effect, OCF is the bulk of  running the business before the costs of the infrastructure, M&A and financing costs. This shows you the effect of selling at low prices. As we can see here, Amazon’s OCF margin has been very roughly stable for a decade, but the FCF has fallen, due to radically increased capex.

In absolute terms, you can therefore see a business that is spinning out rapidly growing amounts of operating cash flow—over $5bn in the last 12 months—and ploughing it back into the business as capex.

Charting this as lines rather than areas shows just how consistent the growth in capex has been.

One might suggest that in a logistics business with rapid revenue growth, rapid capex growth is only natural, and one should look at the ratio of capex to sales by itself. But in fact, the increase here is even more dramatic. Starting in 2009, Amazon began spending far more on capex for every dollar that comes in the door, and there’s no sign of the rate of increase slowing down.

If Amazon had held capex/sales at the same ratio from 2009, before it exploded, then FCF would look like this. That difference adds up to just over $3bn of cash in the last 12 months. That is, if Amazon was spending the same on capex per dollar of revenue as it was in 2009, it would have kept $3bn more in cash in the last 12 months.

So where’s all the extra capex going? And, crucially, does it need to stay at these new, higher levels to support Amazon’s business, or can it come back down in the future?

It’s pretty apparent that the money is going into more fulfillment capacity (warehouses, to put it crudely) and to AWS. Hence, this chart shows an enormous increase in Amazon’s physical infrastructure, as measured in square feet—this is almost all fulfillment rather than data centers, though Amazon no longer gives a split.

Pulling apart precisely where the money’s going, though, is a little fiddlier. The increase is driven by some combination of four things:

  1. More capacity for more products, including 3P products
  2. Proximity—as Amazon builds warehouses closer to customers, the shipping time goes down and so too does the shipping cost, a further flywheel effect for Prime
  3. AWS
  4. More expensive warehouses—that is, the existing business is becoming more expensive to run

The first two of these are straightforward investment in the future, often delivering higher future margins. AWS is a black box and a much debated puzzle, but it is also pretty much the definition of a new business that requires investment to grow. The real bear case here would be the last point— that the existing business is becoming more capex-intensive—that more dollars of capex are needed for every dollar of current revenue.

Just to make life harder for those looking to understand Amazon’s financials, the warehouse expansion, capex expansion and AWS build-out all started at roughly the same time, and at that same moment Amazon changed the way it reports to make it very hard to pick them apart. Until 2010 it split both property and asset value between fulfillment and data centers, but at that point it stopped, probably not by coincidence (in 2010 Amazon had just 775,000 square feet for data centers and customer service combined). In the meantime, there are various metrics (capex per square foot, for example) that would show a shift of spending from cheap warehouse to expensive data centers—but they would also show a shift from maintaining existing warehouses to building new ones. So there is no direct, easy way we can see the split.

We can still, though, get a something of a sense of the key warehouse question—has the business gotten more expensive to run? It looks like the answer is no. First, the third party sales do not seem to be the issue: ratio of 3P units has not gone up at anything like the way the capex/sales has over the same period (here’s that chart again).

Neither is there any sign of a shift in the fulfillment costs over the period (Amazon seems to have forgotten to stop disclosing these). The physical product mix hasn’t got dramatically more expensive to ship, so would it get dramatically more capex-intensive to warehouse? This is obviously not an exact proxy, but it seems unlikely.

15.png

So, though we can’t be sure, it looks like the capex is not going up because Amazon’s existing business has become more expensive to run, but because Amazon is investing the growing pool of operation cash flow into the future. All of this brings us back to the beginning—Amazon’s business is delivering very rapid revenue growth but not accumulating any surplus cash or profits, because every penny of cash is being ploughed back into expanding the business further. But, this is not because any given business runs permanently at a loss—it is because the profits from what is already there are spent on making new businesses. In the past, that was mostly in operations, but in recent years the investment firehose has again been pointed at capex.

How long will this investment go on for? Well, do we believe that the conversion of products and businesses to online commerce is finished? Let’s rebase that revenue chart, and look at it as share of US retail revenue. Excluding gasoline, food and things like timber and plants, all hard to ship, at least for now, Amazon has about 1%.

Overall, US commerce is growing very consistently:

And Amazon is taking an accelerating share of it.

Amazon has perhaps 1% of the US retail market by value. Should it stop entering new categories and markets and instead take profit, and by extension leave those segments and markets for other companies? Or should it keep investing to sweep them into the platform? Jeff Bezos’s view is pretty clear: keep investing, because to take profit out of the business would be to waste the opportunity. He seems very happy to keep seizing new opportunities, creating new businesses, and using every last penny to do it.

Still, investors put their money into companies, Amazon and any other, with the expectation that at some point they will get cash out. With Amazon, Bezos is deferring that profit-producing, investor-rewarding day almost indefinitely into the future. This prompts the suggestion that Amazon is the world’s biggest ‘lifestyle business’—Bezos is running it for fun, not to deliver economic returns to shareholders, at least not any time soon.

But while he certainly does seem to be having fun, he is also building a company, with all the cash he can get his hands on, to capture a larger and larger share of the future of commerce. When you buy Amazon stock (the main currency with which Amazon employees are paid, incidentally), you are buying a bet that he can convert a huge portion of all commerce to flow through the Amazon machine. The question to ask isn’t whether Amazon is some profitless ponzi scheme, but whether you believe Bezos can capture the future. That, and how long are you willing to wait?


Source: http://qz.com/262701/why-amazon-has-no-profit-and-why-it-works/

Is Amazon A Giant Ponzi Scheme Dressed In Drag?

The recent run-up in Amazon.com’s (NASDAQ:AMZN) stock price inspired me to revisit an old thorn in my side. AMZN is up 12.2% since the beginning of 2013, despite a very tough retail sales environment and despite the fact that California and some other states now collect what is known as „the Amazon tax.“ In addition, a bill to collect a Federal Internet sales tax was reintroduced in Congress two weeks ago: Online sales tax.

With this in mind, I decided to peruse AMZN’s 2012 10-K, something I had not done in years, to see what was going beneath the headline „veneer“ applied heavily to AMZN’s quarterly sales and net income results.

I knew that AMZN was using some controversial accounting methodologies, but when I pulled apart the financial statements and applied some old fashioned financial analysis, what I found with regard to AMZN’s cost structure, cash flow and true profitability was quite shocking. Looking at some income statements, cash flow from operations and balance sheet indicators, some of which Wall Street never discusses – AMZN looks somewhat like a Ponzi scheme. I say this because I believe it is likely that a serious cash problem for AMZN will develop if its sales growth slows down or even goes flat.

Let’s look at some numbers I put together by „pulling apart“ AMZN’s financial statements from its 2012 10-K (linked for your convenience). I created the table below to focus on what I consider to be the key metrics in understanding the true ability of AMZN’s business model to generate meaningful cash flow. Standard GAAP/adjusted-GAAP accounting statements often use accounting gimmicks that mask true profitability, which I’ll demonstrate below:

Amazon-Ponzi-Scheme

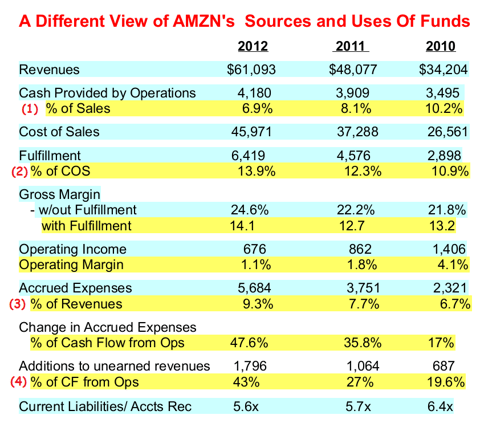
First, I wanted to look at cash flow generated by operations. This number is a fairly „clean“ indicator of how profitable the business model is, as it adjusts the reported income for all non-cash charges, adjusts for any non-operating gains/losses and reflects cash required to finance receivables and make vendor financing payments. As you can see, despite robust sales growth over the last three years, the cash generated by each additional dollar of sales is decreasing rapidly, as reflected by the trend shown in line (1) above. While it’s true that a smaller percentage of a growing sales number is still an increase, you can see that from 2011 to 2012 sales jumped by $13 billion but operational cash flow only increased by $271 million. This is a red flag. Please note, this cash flow number does not include AMZN’s big capex program – it’s purely a measure of AMZN’s organic operational profitability

Second, I believe a big part of the declining cash flow margin comes from AMZN’s cost of fulfillment – the cost delivering products to the end-buyer. I have always believed that AMZN’s business model generated tremendous sales growth because AMZN’s fulfillment strategy, in effect, heavily „subsidizes“ the all-in price paid by the customer. As you can see in (2) above, AMZN’s fulfillment costs have increased as a percent of its cost of goods sold in each of the last three years.

In fact, the way AMZN accounts for fulfillment is quite controversial: AMZN’s accounting. AMZN does not include fulfillment costs in its cost of goods sold (COGS), despite the fact that shipping – getting sold products to the buyer – is an integral part of the all-in cost of products sold in AMZN’s business model/strategy. AMZN’s „holy grail“ is that it can sell products over the Internet more profitably than „brick and mortar“ retailers, so the cost of delivery should be part of the cost of sales.

It’s a grey area of FASB rules, but not including this expense in the COGS distorts AMZN’s gross margins vs. that of competitors. (2) in the table above shows AMZN’s gross margin with and without fulfillment costs. As you can see from the difference in the two metrics, AMZN is heavily incentivized to keep the cost of fulfillment out of its COGS calculation. Gross margin is a key metric for analyzing profitability. In 2012, Target’s (NYSE:TGT) gross margin was 31%, Wal-Mart’s (NYSE:WMT) was 25% and Best Buy’s (NYSE:BBY) was 24.6%. You can see why AMZN has refused to consider fulfillment costs as part of the cost of a product, despite the fact that it is a key component in generating revenue. Fulfillment costs have been a rising part of AMZN’s overall product cost. As the cost of energy, and there the cost of shipping, increases it will put even more of a squeeze on the cash margin AMZN earns with each sale.

Third, AMZN’s operating margin is razor thin compared to its comparables. You can see from (3) in the table above that it’s been deteriorating quickly over the last three years. For 2012, TGT and WMT had operating margins of 7.6% and 5.6%, respectively. Remember, AMZN’s theory with its business model is that it can operate less expensively than its „brick and mortar“ rivals. The numbers for the last three years suggest that AMZN fails to deliver on this.

Let’s now look a little more deeply at the cash being generated by AMZN’s operations and why I believe AMZN resembles more of a Ponzi scheme than people realize. In addition to cash being generated by sales, „cash provided by operations“ also includes changes in working capital. Inventory is a use of cash; accounts receivable, accounts payable and other current liability accruals are sources of cash.

Retailers tend to have a much larger amount of accounts payable than they do receivables. Cash comes immediately from sales and companies negotiate payment terms from vendors, etc, thereby giving retailers the „float“ on cash generated by operations. In order for this model to work, it is important for sales to grow over time, as the „velocity“ of „cash in“ needs to stay ahead of the velocity of „cash out,“ otherwise a liquidity problem can develop.

I chose to isolate and focus on AMZN’s accrued expenses because the payables have been increasing at a normal rate. However, the accrued expense account (3) has been increasingly a significant portion of AMZN’s „cash provided by operations,“ – its „cash in.“ As you can see from the table above, accrued expenses are growing and have gone from just 17% of cash flow from operations to over 47%. This is a big red flag.

Accrued expenses are largely cash from the sale of gift cards. If gift cards go unused, and some do, they accrue 100% to operating income. AMZN doesn’t disclose the other sources of accrued expenses, but it isolates „unearned revenues“ in its cash flow statement (4) – this is gift card cash. As you can see, gift card sales have been a growing source of cash funding over the last three years, representing 43% of cash generated by operations in 2012. If I didn’t know exactly what business AMZN was in, I would be under the impression that it was trying to become a gift card sales operation.

My point here is that – at 43% of cash generated by operations – AMZN is become increasingly reliant on the „float“ it gets from gift cards in order to fund its operations on a short term basis. If AMZN’s revenues slow down or its expenses unexpectedly increase, for whatever reason, AMZN could face liquidity problems.

What happens if sales slow down because of a bad economy or predatory competitors? On Monday (March 3) Wal-Mart announced that it was going to start going after AMZN’s „Marketplace“ web vendor business: Wal-Mart/Amazon. This will likely „cannibalize“ AMZN’s „net service sales,“ which has gone from 10% of revenues to nearly 15% over the last three years. AMZN doesn’t break out its income from its revenue segments, but its Marketplace business is likely very high margin, meaning it’s become an important part of cash generated by operations. In addition, the imposition of the internet „Amazon tax“ will increase the customer’s all-in cost to buy from AMZN, which could significantly impact sales negatively.

AMZN’s market cap as of the 3/7/2013 close is $124.5 billion. Based on 2012 operating income, it’s trading at 185x operating income. For comparison purposes, WMT and TGT trade respectively at 9.2x and 8x their 2012 operating income. The p/e comparison is irrelevant because AMZN lost money on a net income basis in 2012, but that multiple of cash flow unequivocally represents an irrational „bubble“ valuation.

AMZN’s market cap has always been one of the unsolved mysteries of the stock market. Moreover, in its entire operating history, AMZN has never generated meaningful income or cash flow. It is clearly highly overvalued relative to its peers. But, I have rarely made money either shorting the stock or buying puts. It’s been a long-time source of frustration and at this point I’m going to wait until I see the signs that the Ponzi-like cash funding scheme AMZN has in place starts to deteriorate and then I’m going to pounce hard on the short side. Given that retail sales seem to be slowing down – and by some metrics declining – with the economy, and given that Wal-Mart is going to start throwing its weight around at one of AMZN’s key sources of cash flow, I don’t think I’ll have to wait much longer.